Velocity in SCRUM
Understand velocity in Agile development - a crucial metric for measuring team performance, sprint planning, and project forecasting. Learn how to calculate, use, and interpret velocity charts effectively.
Velocity in SCRUM
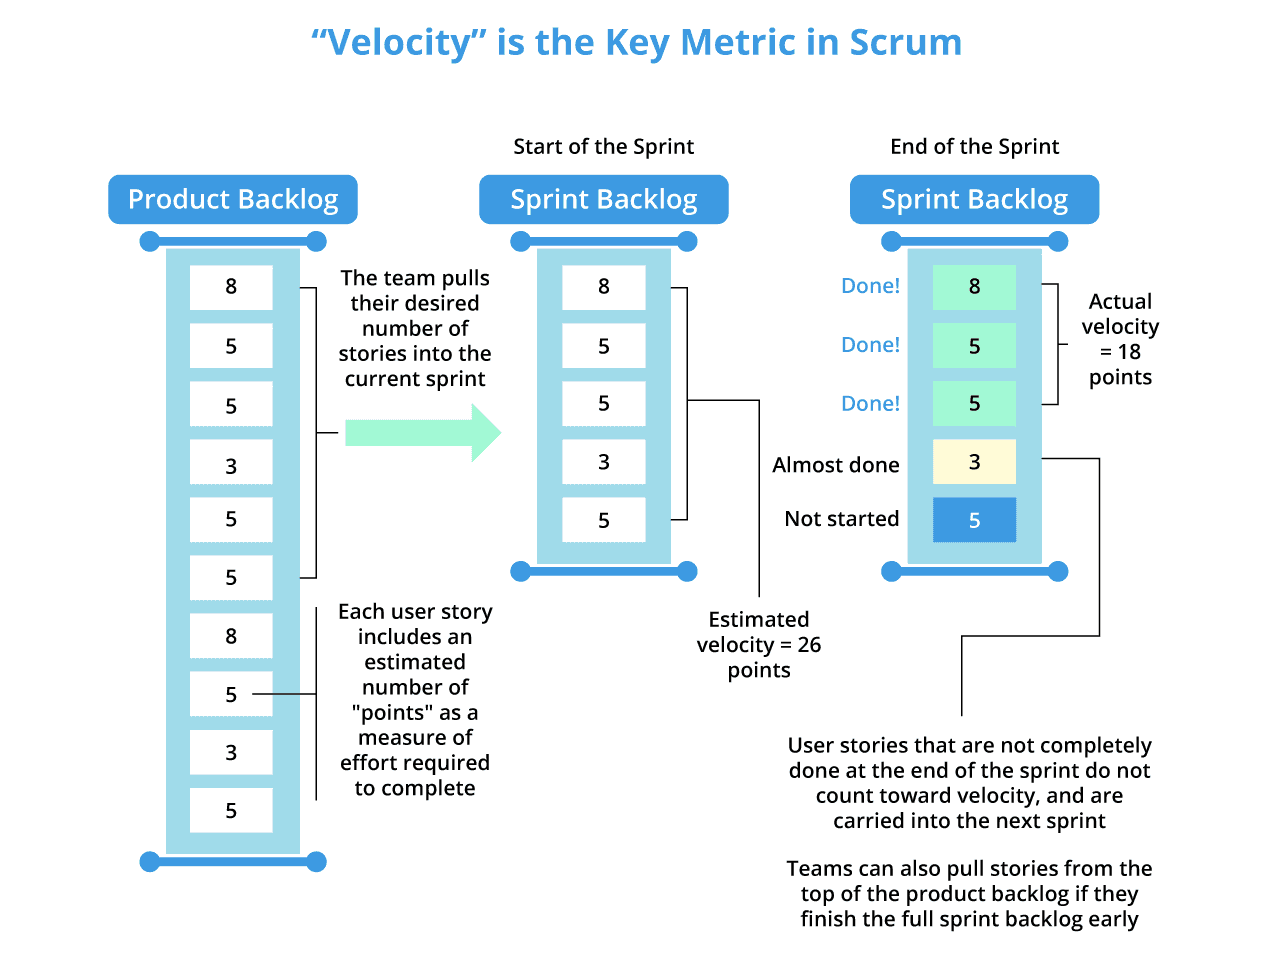
Velocity is an indicator used in projects managed using an agile method, for instance with the SCRUM framework. Agile velocity helps determine the effort an agile development team can provide for completing tasks scheduled within a sprint. It is expressed in terms of points.
Understanding Velocity
The Product Owner places a certain number of features or items to be realized during the sprint in the Product Backlog, generally formalized as user stories. The development team assigns a certain number of points to each Product Backlog Item (PBI). These points represent both the complexity and the estimated duration of completing the PBI empirically.
Note:
It is not a linear scale; the Fibonacci sequence is often used for story point estimation.
Story Point Values
The values that can be assigned include:
Who Is Responsible for Estimating PBIs?
Product Owner Role
The Product Owner is responsible for providing the features or items to be completed during the sprint in the Product Backlog.
Team Capacity Assessment
During the planning session, the team must consider its capacity to determine the average velocity.
Development Team Estimation
Only the development team is capable of estimating PBIs. They are responsible for distributing points empirically to each PBI.
Validation and Revision
Once defined, velocity will be used to validate or revise the development plan.
Velocity Calculation Example
Note:
Important principle: The velocity in future iterations will be more or less equal to the previous one.
Example: If stories A and B (each estimated at 2 points) are 100% complete, and story C (3 points) is only 80% complete, the iteration's velocity will be 4 points (only completed stories count).
Velocity can also be calculated by considering story points. The velocity of a specific sprint is calculated by multiplying the number of completed user stories in the sprint by the story points assigned to each user story.
Example calculation:
- Completed user stories: 4
- Story points per story: 3
- Total velocity = 4 × 3 = 12 points
How to Use Average Velocity in Agile Development
Agile is synonymous with iterative development, rapid solutions, and rapid product market entry. To achieve this, Agile teams must know how much work they can do in a sprint and how long it will take to complete the project or deliver a functional version to the client.
Calculating Average Velocity
Note:
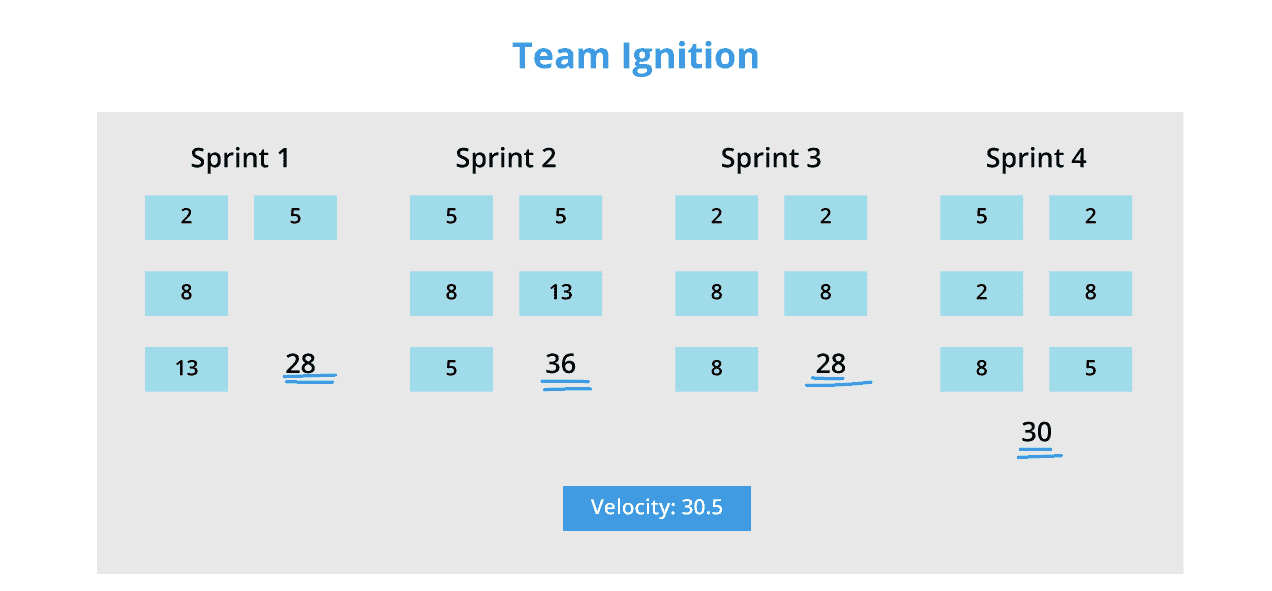
Average velocity is calculated once the project has progressed through three or four sprints (iterations). Average velocity is calculated by averaging the story points accumulated in each sprint.
Practical example:
- Sprint 1: 10 points
- Sprint 2: 12 points
- Sprint 3: 14 points
- Sprint 4: 12 points
- Average velocity = (10 + 12 + 14 + 12) ÷ 4 = 12 points per sprint
Project Planning with Velocity
Using the example above of the average velocity of a sprint, you can assume that the team can complete work at a rate of 12 story points per sprint. So, if you have 120 story points left to complete in your project, you can estimate that you'll need 10 more sprints to finish the project.
Note:
While this calculation is generally accurate, it's subject to fluctuations depending on changing requirements, team size, and project complexity.
Agile Velocity Chart
The Agile method offers various tools to visually represent data points. These tools provide an easy indicator of project progress, and if cloud-based, they can be accessed by all project stakeholders.
Agile velocity charts are essentially graphs, with story points displayed on one axis, and completed sprints shown on the opposite axis. They are an excellent way to make your project's velocity accessible to everyone.

Reading Velocity Charts
A velocity chart is a great way to:
- Track project progress over time
- Identify consistency in team performance
- Spot patterns in the team's sprint velocity
- Detect irregularities that might indicate problems
Note:
If your charts show many irregular peaks and troughs, you might conclude that your project is unpredictable, as velocity isn't consistent.
Benefits of Measuring Velocity
Essential for Release Planning
Note:
Velocity is crucial for release planning as it helps the Product Owner determine how many sprints are needed to create a product with the desired features. By estimating the number of necessary sprints, the Product Owner can estimate the release date.
Feedback for the Team
Velocity is an excellent metric for measuring the team's progress. By tracking velocity over time, teams can measure whether the changes they make during the sprint improve or reduce productivity.
- New teams: Velocity can fluctuate significantly
- Experienced teams: Have consistent velocity and can measure progress through velocity charts
Forecasting
Velocity helps the team identify how many user stories they can complete in a sprint. Predictability is an important factor that helps teams make decisions about project timelines and budgets.
Note:
Forecasting is usually done by taking the average velocity of the last three sprints.
Drawbacks and Limitations
Empirical Nature
Note:
While velocity is an excellent metric for measuring the team's progress, it's important to remember that it's an empirical measure, which means it can be used for estimation but not as the final standard for measuring the team's progress.
Velocity is often based on story points, which are subjective to the team. Teams may have their own values for story points for user stories and, therefore, define their velocity and scope of work.
Common Issues
Conclusion
Velocity is an important measure used by Scrum Masters and Product Owners to track their team's progress and ensure project success. Agile's fast response, rapid delivery, incremental, and iterative framework ensures rapid releases, quality products, and customer satisfaction.
Note:
Velocity helps determine project timelines and allows product owners to provide accurate estimates without falling into the overcommitment trap.
Key takeaways:
- Velocity is a team-specific metric that improves with experience
- Use it for planning and forecasting, not for comparing teams
- Focus on trends and consistency rather than absolute values
- Combine with other metrics for a complete picture of team performance